While discussing candlestick patterns, we had learnt about the entry and the stoploss points, however the target price was not discussed. We will discuss the same in this chapter.
The best way to identify the target price is to identify the support and the resistance points. The support and resistance (S&R) are specific price points on a chart which are expected to attract maximum amount of either buying or selling. The support price is a price at which one can expect more buyers than sellers. Likewise the resistance price is a price at which one can expect more sellers than buyers.
On a standalone basis traders can use S&R to identify trade entry points as well.
The Resistance
As the name suggests, resistance is something which stops the price from rising further. The resistance level is a price point on the chart where traders expect maximum supply (in terms of selling) for the stock/index. The resistance level is always above the current market price.
The likely hood of the price rising up to the resistance level, consolidating, absorbing all the supply, and then declining is high. The resistance is one of the critical technical analysis tool which market participants look at in a rising market. The resistance often acts as a trigger to sell.
Here is the chart of Ambuja Cements Limited. The horizontal line coinciding at Rs.215 on chart, marks the resistance level for Ambuja Cements.
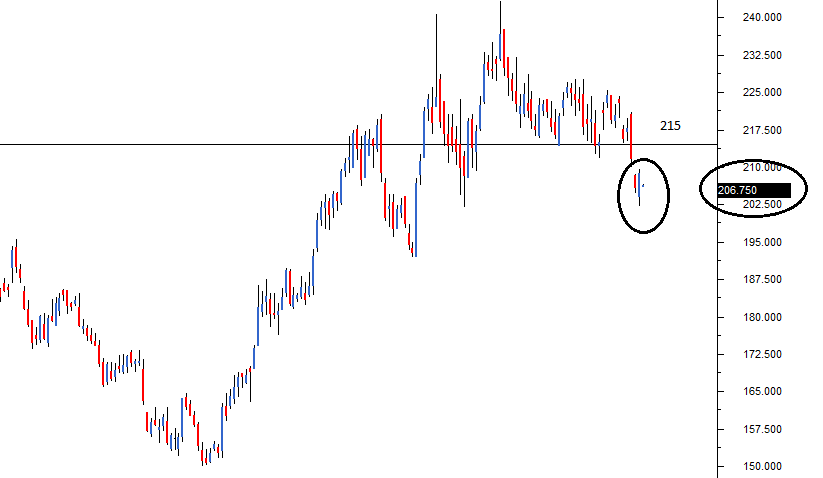
I have deliberately compressed the chart to include more data points, the reasons for which I will shortly explain. But before that there are two things that you need to pay attention to while looking at the above chart:
- The resistance level, indicated by a horizontal line, is higher than the current market price.
- While the resistance level is at 215, the current candle is at 206.75. The current candle and its corresponding price level are encircled for your reference
For a moment let us imagine Ambuja cements at Rs.206 forming a bullish marubuzo with a low of 202. We know this is a signal to initiate a long trade, and we also know that the stoploss for this trade is at 202. With the new found knowledge on resistance, we now know that we can set 215 as a possible target for this trade!
Why 215 you may wonder? The reasons are simple:-
- Resistance of 215 implies there is a likelihood of excess supply
- Excess supply builds selling pressure
- Selling pressure tends to drag the prices lower
Hence for reasons stated above, when a trader is long he can look at resistance points to set targets and to set exit points for the trade.
Also, with the identification of the resistance the long trade can now be completely designed as follows:
Entry – 206, Stoploss – 202, and Target – 215.
The next obvious question is how do we identify the resistance level? Identifying price points as either a support or resistance is extremely simple. The identification process is the same for both support and resistance. If the current market price is below the identified point, it is called a resistance point; else it is called a support point.
Since the process is the same, let us proceed to understand ‘support’, and we will follow it up with the procedure to identify S&R.
The Support
Having learnt about resistance, understanding the support level should be quite simple and intuitive. As the name suggests, the support is something that prevents the price from falling further. The support level is a price point on the chart where the trader expects maximum demand (in terms of buying) coming into the stock/index. Whenever the price falls to the support line, it is likely to bounce back. The support level isalways below the current market price.
There is a maximum likely hood that the price could fall till the support, consolidate, absorb all the demand, and then start to move upwards. The support is one of the critical technical level market participants look for in a falling market. The support often acts as a trigger to buy.
Here is the chart of Cipla Limited. The horizontal line coinciding at 435 on chart marks the support level for Cipla.
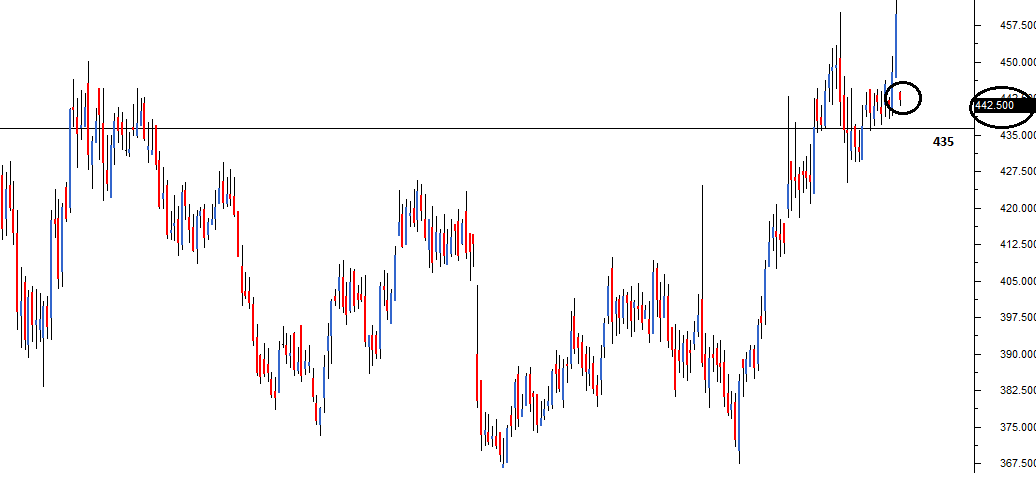
Few things that you need to notice on the chart above:
- The support level, indicated by the horizontal line is below the current market price
- While the support level is at 435, the current candle is at 442.5. The current candle and its corresponding price level are encircled for your reference
Like we did while understanding resistance, let us imagine a bearish pattern formation – perhaps a shooting star at 442 with a high of 446. Clearly with a shooting star, the call is to short Cipla at 442, with 446 as the stoploss. Since we know 435 the immediate support, we can set the target at 435.
So what makes Rs.435 target worthy? The following reasons back the decision:
- Support at 435 implies there is a maximum likely hood of excess demand to emerge
- Excess demand builds buying pressure
- Buying pressure tends to drag the price higher
Hence for the reasons stated above, when a trader is short, he can look at support points to set targets and to set exit points for the trade.
Also, with the identification of the support, the short trade is now completely designed.
Entry – 442, stoploss – 446, and target – 435.


No comments:
Post a Comment