if you have read Part-1 , then you would have one question and many traders would have same question .
Short Term vs Long Term : Which is Better ?
Many Analysts or Traders prefer to specialise in one form of analysis. However I believe that by using the two in tandem you will achieve a much more comprehensive picture as their strengths and weaknesses complement each other very well..
For example, In Long Term patterns project
future direction and price targets,
they can be particularly tricky to time your entrance to a trade with maintaining a decent
reward/risk ratio. And in Short Term patterns generate
great timing for entry signals,
they do not provide you with a profit objective, or much
future direction beyond the candles
you are currently looking at.
Before proceeding further i would like to introduce four words here , which are common in trading .
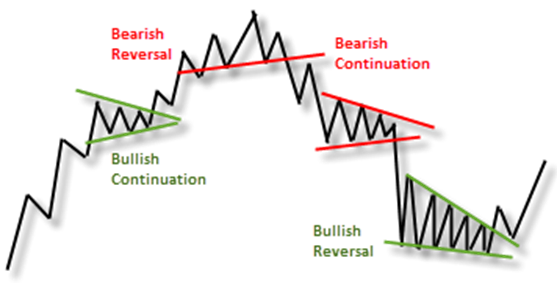
Continuation - When the pattern remains in the same direction as it was before the breakout. for example , if price is moving upwards and it meets resistance and breaks the same . After retesting the support , if it keeps moving in upward direction , so it will be know as continuation.
Reversal - Suppose in above example , if a stock price breaks the support while testing it and moves in downward direction , which is opposite to upward direction , then this move is called Reversal.
Bullish & Bearish - Bullish represent Upward Trend / move of the price , Bearish represent Downward Trend / move of the price.
Trends & Patterns - Once a trend has been established , you will find a continuation pattern in lower time frame. In Simple Words , if you start noticing any trend in the chart with time frame of 30 Min , so in chart with time frame any duration below than 30 min , you will find continuation patter for sure, it happens because of one thing that is price movement . one candle in 30 Min time frame will take 30 min to form where as within those 30 min , 30 candles were completed in 1 min time frame, these 30 candles would have firmed the path of further movement.
Refer Image below , the black solid line is a trend line in higher time frame where green curved lines are movement price of stock in smaller time frame , which is reflecting a continuation of previous move , with several continuation and reversal.


No comments:
Post a Comment